Coming soon · iOS & Android

Knowledge
worth looking at.

Infographics turn complexity into clarity at a glance. They make ideas easier to understand, remember and share. In a world drowning in information, they make the signal impossible to miss.

infogrfk. is a platform for creators and lovers of infographics.

Find what you care about, follow the makers, save what matters, share what lands.

infogrfk.
Following Discover
All topics 673
infogrfk.
AI Explainer

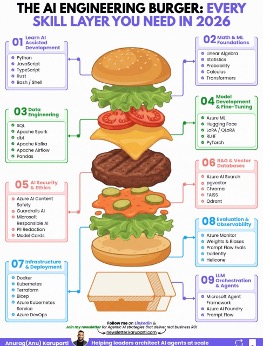
AI vs Machine Learning vs Deep Learning vs Generative AI vs LLM vs AI Agent

AI summary

Six commonly-confused AI terms, defined side by side with the workflow under each.

  • Each layer is a subset of the one above it.
  • Only the agent acts — the rest just output.
1.2k 34
infogrfk.
Studio Nine
@studionine
84Posts 12.4kFollowers 19Topics
Read by AI on arrival· Searchable by meaning· Follow the makers· Save, share, download in HD
The app

Helping makers of infographics find their audiences, and lovers of infographics find what interests them

Intuitive and easy to use, with an AI layer that analyses every graphic, making the knowledge you are looking for easy to find and easy to share.

infogrfk.
Following Discover
Studio NineAI
Field NotesScience
LedgerFinance
Follow, don't hoard

A feed of the makers you chose, like, comment, save, share. No algorithm deciding for you.

infogrfk.
how does a transformer actually work
Closest matches
A Quick Cheat Sheet to Master Agentic AI94% match
AI vs ML vs Deep Learning vs LLM91% match
Neural networks, end to end88% match
Ask and uncover

Search in plain English. infogrfk. matches on what a graphic means and teaches, not just the title and text.

infogrfk.
Summary written
Key insights extracted
Filing by subject…
Science Climate Data viz
Post it, it files itself

Upload a graphic — still or animated — and it comes back read, summarised and filed. Credit stays with the creator.

For creators

The credit lands with the maker

Early principles for how infogrfk. treats the people whose work fills it. They'll firm up before launch — if you make infographics and something here doesn't work for you, tell us now rather than after.

01

No creator, no post

Every upload is analysed on arrival, and working out who made it is part of that. If your name, handle or site isn't on the graphic, it can't be credited — so put it there before you post.

02

Make it or curate it

Two ways in: publish your own work, or build the definitive collection on a subject you know. Both are first-class — and either way the credit goes to whoever made the graphic.

03

You see what the AI wrote

Every graphic gets a summary, its key insights and a place in the taxonomy. That analysis is shown to you, not hidden behind the feed — and on your own work you can correct it.

04

Your originals stay yours

The feed shows a thumbnail. The high-resolution file stays download-gated, and the credit travels with the graphic wherever it ends up.

05

Still or moving

An infographic isn't only a static image. Animated data visualisation — a bar-chart race, a timeline that plays — is a post in its own right, not an attachment.

These are working principles for the beta, not final terms. Tell us where they're wrong.

Contact

Get in touch

Want early access, to bring your infographics to infogrfk, or to talk partnerships? Drop us a line and we'll get back to you.

admin@infogrfk.com

We'll use your details to reply to you, and — only if you tick the box — to let you know when early access opens. We don't sell your data. See our privacy notice.